Risk is a horizon-dependent concept
The range of outcomes for investment returns changes depending on how far into the future you look. At a basic level, this is intuitive, since a longer time span allows secular forces to shift. Economic growth changes with technological advances and demographics, monetary policy and inflation regimes change, geopolitical environments evolve. This is important as it suggests that markets and investment opportunities should be viewed differently depending on whether you are a short- or long-term investor.[1]
It is worth providing more precise definitions. When talking about risk, we are describing the outcomes where asset returns do not materialize as expected, especially on the downside. These deviations from the expected path can be accounted for using different drivers. As outlined in this article, these could be changing expectations of growth, inflation, real interest rates, risk premiums, and more.
Asset return distributions change by horizon
When it comes to asset allocation, an extra layer of complexity arises when thinking about risk. The risks embedded in a stock, bond, real estate etc. investment all change whether you view them over a day, a year, or a decade. The same is true when combining assets into a portfolio, where common macro drivers generate changing correlations over different horizons.
These high-level ideas are relatively well-accepted in the investment world, but we find the specifics are rarely spelled out. It is common to assert that there is ‘mean reversion’ in markets. This implies that certain changes in asset prices are temporary, another way of saying the range of outcomes depends on the investment horizon.
We try to more precisely account for changing risks and return drivers by horizon. The present-value approach in asset allocation modelling makes this complex problem more accessible.[2] This is most easily shown for inflation-indexed government bonds. We can build an illustration using our simulation models. Over a large number of simulation paths, we run a strategy where we allocate all capital to buy and hold a 10-year inflation-linked government bond.
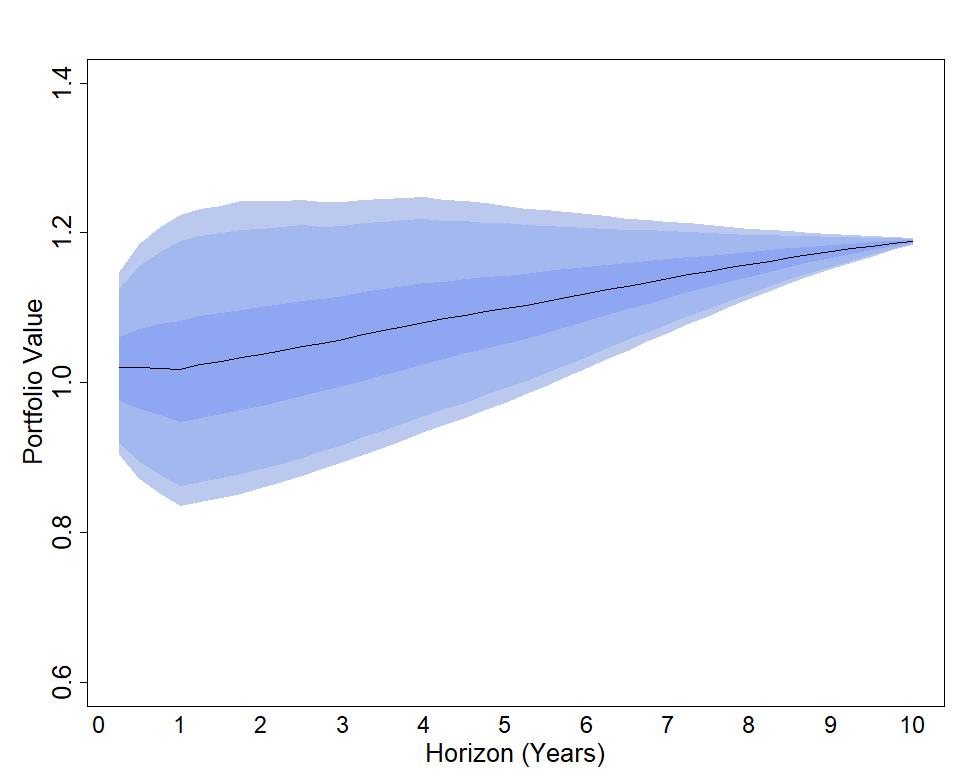
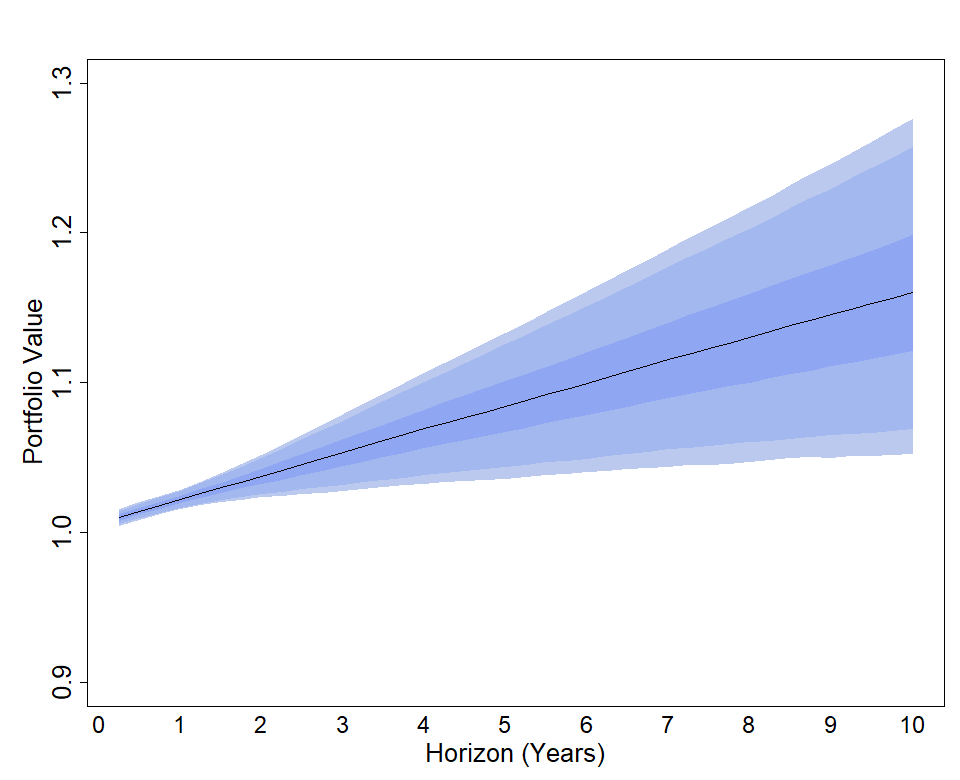
Figure 1 shows the distribution of strategy performance changes at different horizons. A wider ‘fan’ means a higher risk.[3] We measure performance in real terms, adjusting nominal returns for cumulative inflation at each horizon. Risk changes by horizon: holding the 10-year bond for a year is risky, holding the bond for 10 years is risk-free. Figure 2 repeats this exercise with a 1-year bond, and the pattern flips. Holding the 1-year bond for 1-year is risk-free, and rolling over the 1-year bond for 10-years is very risky. While very simple examples, these simulations can spell out intuitions that are difficult to see directly when using statistical models of asset returns. The same horizon exercises are interesting but more complicated for different asset classes (in particular equity – without a defined maturity) or portfolio strategies (for example rebalancing to a target duration government bond portfolio).
Figure 1: Simulated returns on 10-year inflation-linked bond over different horizons

Figure 2: Simulated returns on 1-year inflation-linked bond over different horizons

The charts show distributions of real returns at different investment horizons. The black line shows the mean path for returns. The inner band covers 50 percent of paths around the mean. The lighter outer bands cover the next 25 percent and 10 percent of probabilities.
Asset return drivers change by horizon
We can take a further step in understanding the fundamental drivers of the distribution of returns. Our research has explored how the relative importance of drivers also changes by horizon.[4] A key feature of our modelling is to consider the behaviour of long-term components of asset prices – which we refer to as ‘macro trends’.[5] The importance of trends grows with investment horizon.
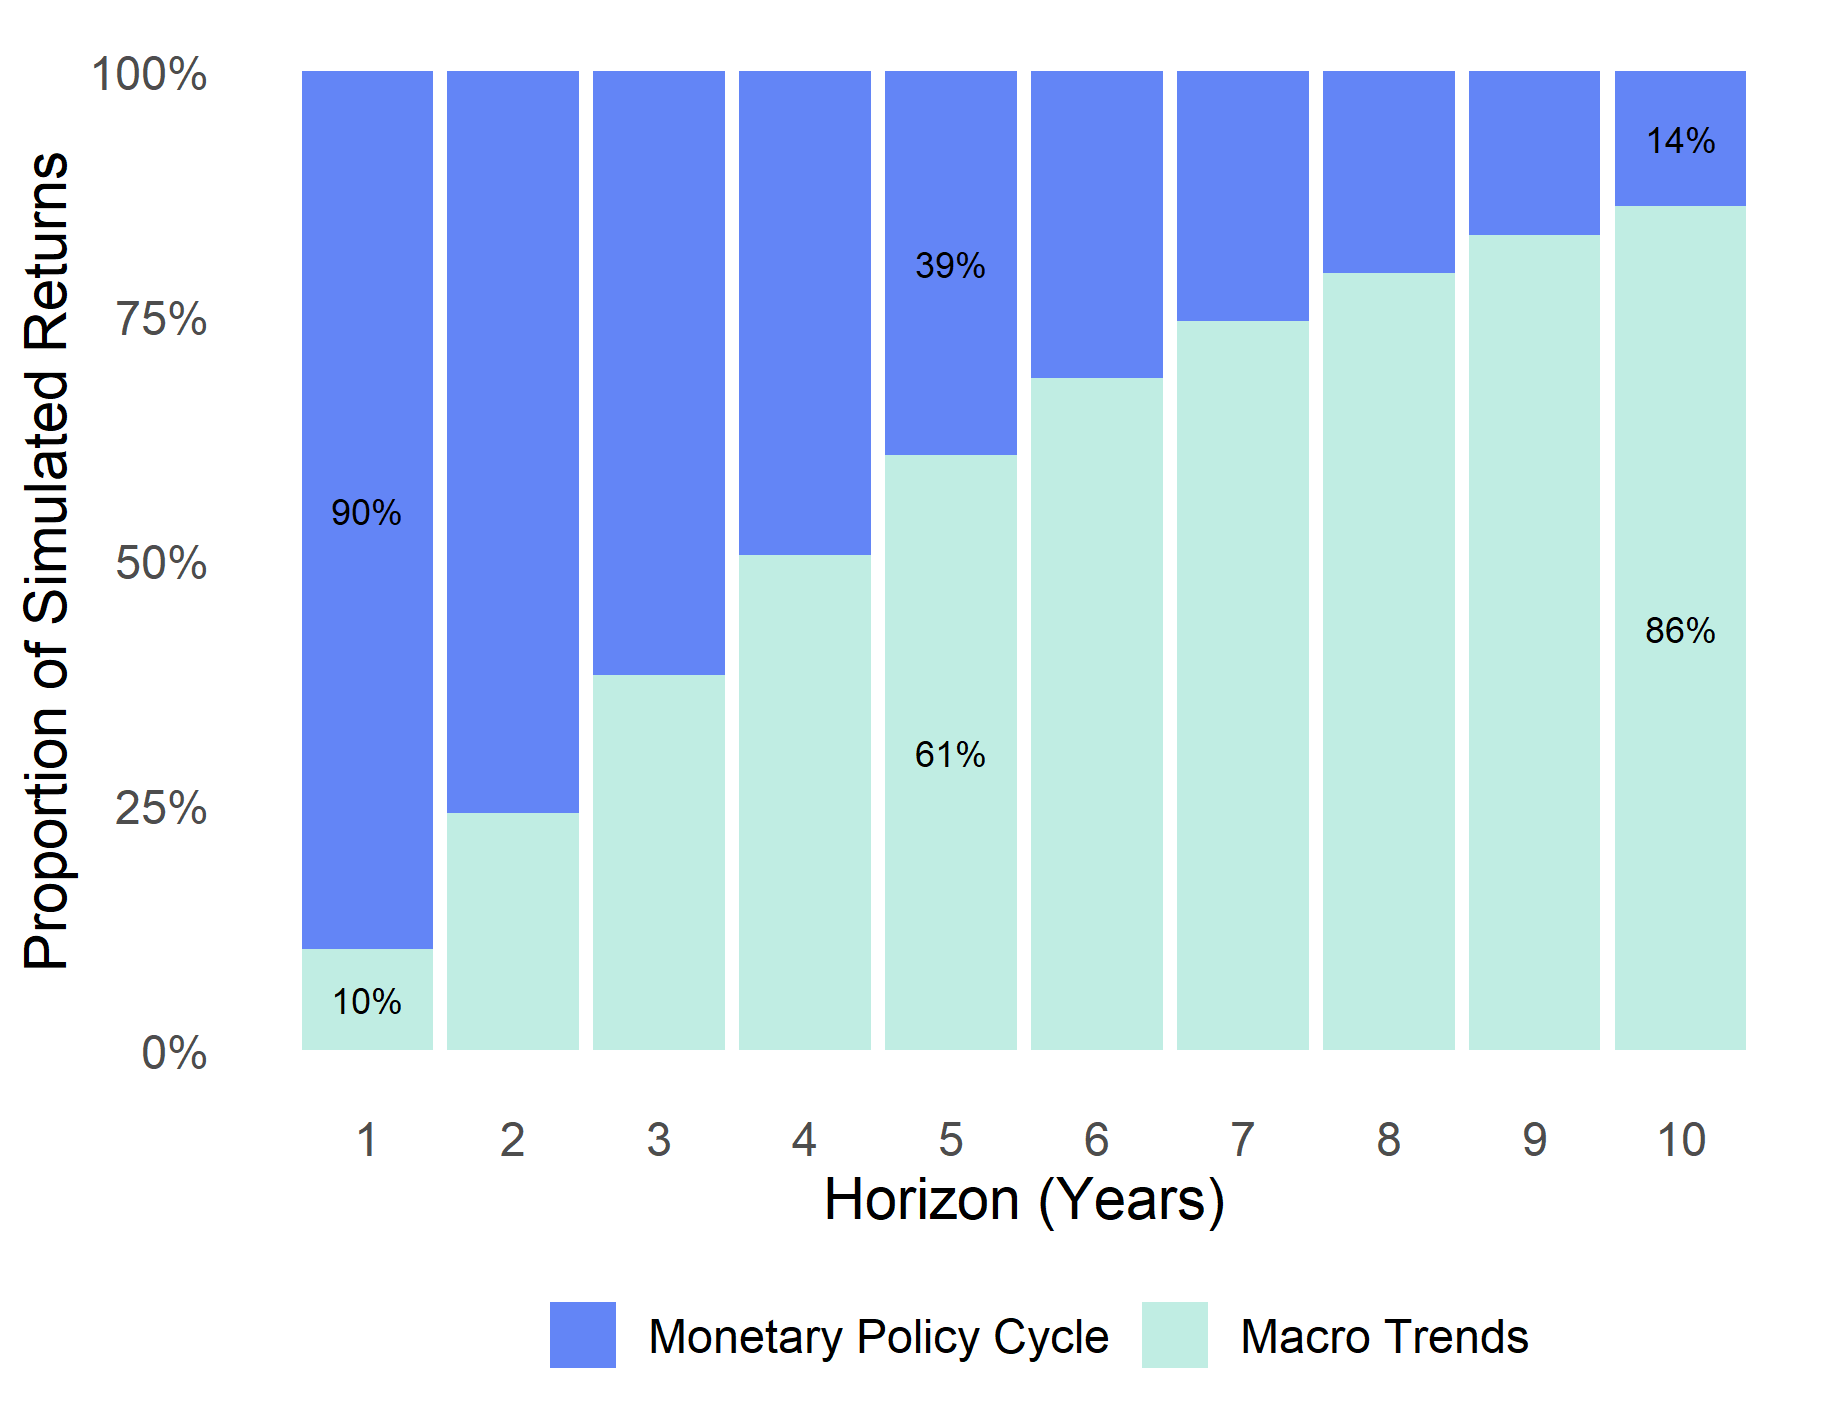
Figure 3 uses the simulation model to understand the shifts in drivers by horizon for a short-term bond. The figure breaks down the variance of outcomes across simulation paths. At shorter horizons, monetary policy cycles matter most. At the 1-year horizon, for example, when simulated returns differ from expected returns around 90 percent of these differences are due to cyclical re-pricing of monetary policy expectations. At longer horizons, however, macro trends quickly become the dominant factor. At the 10-year horizon, variation in returns is primarily due to long-term changes in trend components of the yield curve. The growing importance of trends with horizon makes them a key feature of simulating returns for long-term investors.
The mix of return drivers impacts volatility and correlation assumptions that feed into asset allocation and portfolio construction. We have shown in our research on Real Estate how changing correlation patterns over horizons can be understood through return driver exposures.[6]
Figure 3: Proportion of simulated return variance driven by macro trends and monetary policy cycle variation

Exploring asset classes and strategies across horizons
For introducing risks across horizons, we have mostly confined our discussion to risk-free inflation-linked government bonds.[6] There is huge scope for exploring horizon risks in a similar manner for any asset class and strategy. Portfolio risk profiles across horizons can shift in many different ways depending on asset class weights, asset durations, and rebalancing approaches. An understanding of risk and its drivers is essential for designing asset allocation policies, and we continue this research with our clients.
Interested in finding out more? Use our contact form to continue the discussion.